.jpg)

MartinJenkins Partner Sarah Baddeley and Senior Consultant Alice Russon look at what New Zealand’s return to pre-pandemic visitor numbers means, and at what the World Economic Forum’s latest tourism index says about the challenges that come next.
In July last year, Sarah wrote that New Zealand tourism was at a turning point. Overseas visitor arrivals were then running at 87% of pre-pandemic levels. The question was less whether the numbers would come back than what kind of recovery we wanted.
Fourteen months on, the numbers have come back, at least for one month, with 256,600 overseas visitors arriving in July 2026, which is 100.4% of the July 2019 figure. It’s the first month since the border reopened that arrivals have passed the pre-COVID equivalent.
Our friends from across the ditch have driven our result. A record 134,900 Australians arrived in July, more than half of all visitors.
However, the annual picture is still short, with 3.69 million arrivals in the year to July 2026, against 3.89 million in the year to July 2019.
The global discussion has moved on
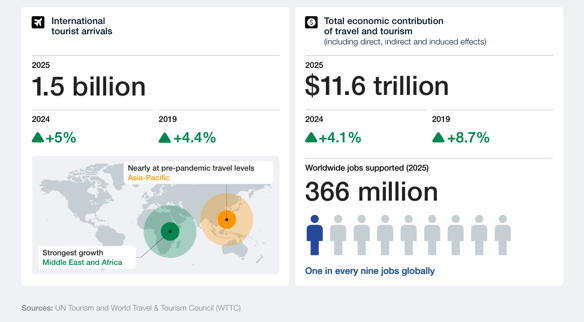
The World Economic Forum’s Travel & Tourism Development Index 2026, published in September, suggests that much of the world passed this milestone some time ago. International arrivals reached a record 1.5 billion in 2025. The report argues that the challenge has shifted from rebuilding demand to managing it.
The index doesn’t count visitors. It measures the conditions that let a country attract and sustain tourism: infrastructure, openness, prices, natural and cultural assets, workforce, and sustainability.
New Zealand ranks 25th of 110 economies on the index, up three places since 2024, but four places lower than in 2019. In other words, we’ve regained ground but not position. Australia, by comparison, ranks fourth.
Three constraints: Price, public support, and people
WEF’s Travel & Tourism Development Index points to three constraints that are tightening as tourism grows. New Zealand is feeling the sharp edge of each of these, even with our dollar weakening.
Price
The first is affordability. Price competitiveness fell in three-quarters of the economies the WEF ranked, as fuel, labour, food, and accommodation costs outpaced inflation.
For a long-haul destination like Aotearoa, the cost of getting here matters as much as the cost of staying. This year’s disruption to the Middle East aviation corridor linking Europe, Asia, and Australia is a reminder of how exposed those routes are.
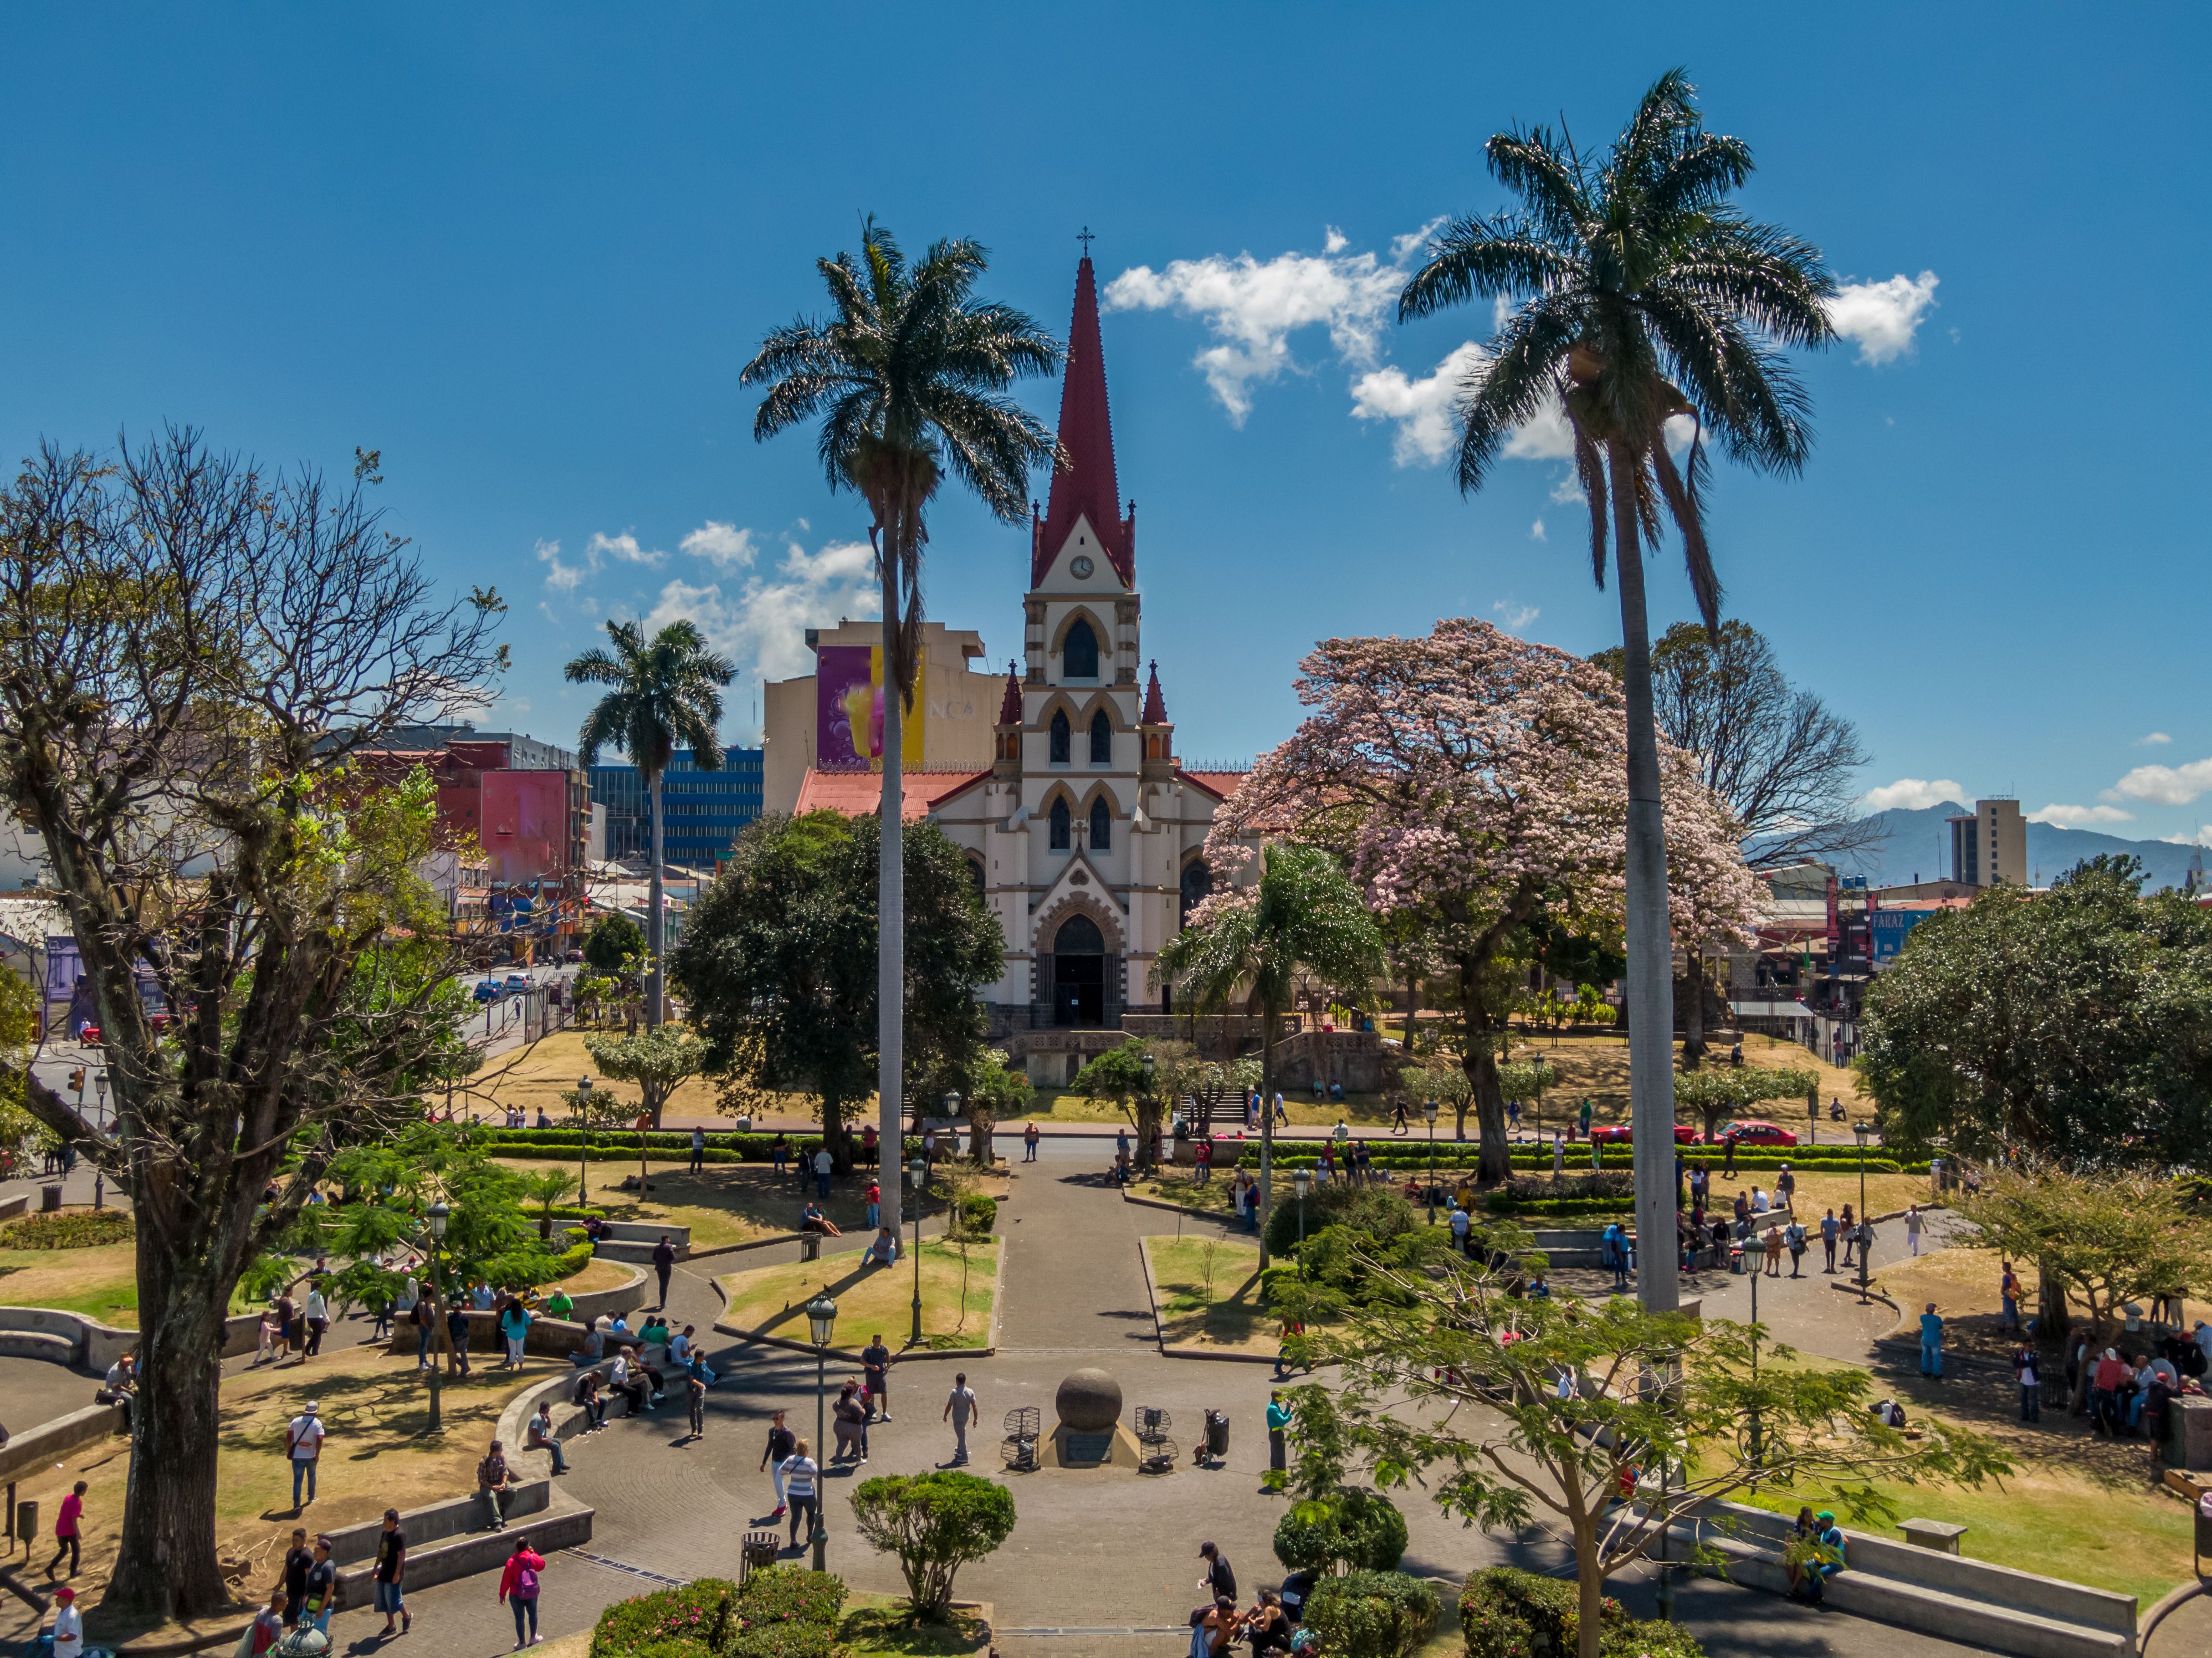
The WEF’s response is that destinations need to compete on value rather than price. Costa Rica is its example: the country ranks 86th on price competitiveness, yet average spending per visitor rose about 15% in 2025 while arrivals grew by only around 1%. This shows that visitors will pay more if they think the experience is worth it.
Public support
The second pressure is that more visitors does not automatically mean wider benefits. The index’s measure of tourism’s socio-economic contribution, which covers high-wage jobs and spillovers into the wider economy, fell 3.5% globally, and improved in only 17% of economies.
Last year we pointed to the strain felt by residents in Queenstown and Wānaka. Where local benefits are hard to see, public support for tourism wears thin.
The WEF suggests that part of the answer is making those benefits visible. New York City, for example, reports that visitor spending generated almost US$7 billion in tax revenue in 2024, roughly US$2,000 for every household.
New Zealand has its own tools here. The International Visitor Conservation and Tourism Levy is one way visitors already contribute to the places they come to see. But just as important as collecting the levy is being clear about where that levy money goes, what it pays for, and how it brings value.

People
The third pressure is people. The WEF projects a global shortfall of 43 million tourism workers by 2035, or 16% below what the sector will need.
Our unemployment rate indicates we have capacity to meet the sector’s needs. However, labour-market matching for tourism jobs has always been difficult because of their seasonality, their locations, and the flexibility they demand of workers.
Spreading the load
Japan, now ranked first in the WEF’s index, offers a useful contrast. It has deliberately and successfully sought to attract visitors from a broader range of countries, and has also broadened where in Japan they go.
The share of visitors from Japan’s main East Asian source markets fell from 70% in 2019 to 65% in 2025. In October 2025, international visitor nights in regional areas were up 14.1% on a year earlier, while nights in its three main urban areas fell slightly.

For New Zealand, Australia’s dominance is both a strength and a risk. Short-haul visitors are less exposed to fuel price shocks and route disruptions. But relying heavily on one market leaves us vulnerable if that market’s economy or travel habits change.
Spreading demand also depends on being found. More travellers now plan trips with AI tools, and the WEF warns that destination information needs to be accurate, consistent, and machine-readable to show up.
Germany’s national tourist board has brought around 500,000 records from tourism organisations across all 16 states into a single open database that search engines and AI assistants can draw on. For smaller New Zealand regions trying to attract visitors beyond the usual circuit, shared infrastructure like this could matter as much as a marketing campaign.
This is the rationale behind the Government’s applying Visitor Levy funding to help make our destinations and operators easier to find through AI tools. The investment includes upgrading Tourism New Zealand’s systems and database and expanding its own AI travel assistant. Tourism NZ also published guidance and ran workshops for our tourism businesses on how to ensure the experiences they offer are more easily discoverable.
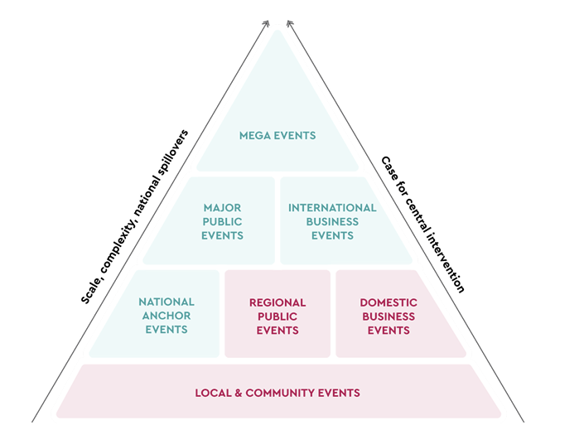
Events are another way to spread visitors across regions and seasons. MartinJenkins’ recent independent review for MBIE of New Zealand’s approach to events found that well-chosen business and regional events can do exactly that. Multi-day business events alone generated an estimated $925 million in spending in 2025. Capturing full value here depends on planning events as a portfolio rather than one bid at a time.
Beyond the numbers
Getting back to 2019 numbers was the first test for our tourism sector, and it took longer than most countries to get there.
Our second test is whether we manage growth so that our tourism industry pays its way by funding the conservation estate and local infrastructure that visitors rely on, by supporting decent jobs, and by keeping residents onside.
In her article last year, Sarah suggested that destinations that fail to plan risk being “either loved to death or left behind”. The 2026 World Economic Forum index makes the same point with more data. The destinations doing best are those whose tourism systems keep working when costs increase, routes close, or demand shifts.
New Zealand has the natural and cultural assets to compete on value. Whether the recovery in visitor numbers adds to the wellbeing of New Zealanders will depend on the choices we make about growth now.